If you don’t use Naviance, the college search and application software that around 40% of US high school students use through their schools, then this one may not be for you. But if your high school does use Naviance, or if you use similar software to help you get personalized college information, please keep reading.
Some research on Naviance has just been released that gives us some good insight into how students use it to make college choices. Christine Mulhern’s paper, titled “Changing College Choices with Personalized Admissions Information at Scale: Evidence on Naviance,” is currently under peer review for publication. (You can see the full paper here. I found it through this report and summary from EdSurge. All quotations are from the introduction of the paper, pages 1-5.) Mulhern details four conclusions.
Seeing is applying. High schools using Naviance can decide when a college’s scattergrams become visible and accessible. Many set it up so that you can’t see a scattergram until at least five or ten students from that school have applied. This makes sense, because a scattergram with only one or two data points isn’t very useful. It also means that some colleges have visible scattergrams, while many do not.
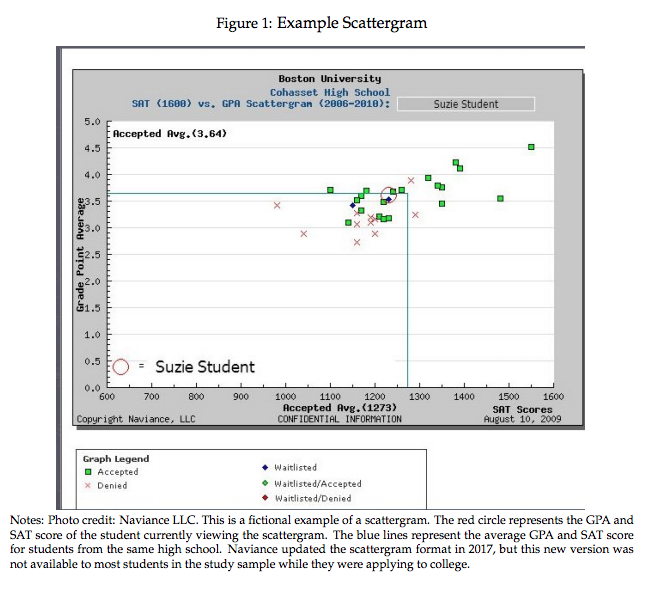
Sample, fictional scattergram from Mulhern’s paper
Mulhern found that whether or not a college has a visible scattergram makes a huge difference. High school students are 20% more likely to apply to schools with scattergrams available, “especially for students with a high probability of admission.” Students who historically have not had good access to this kind of information—“Black, Hispanic, and free or reduced-price lunch students”—are 55% more likely to apply to a college when they can see the college’s scattergram. The effect is also huge for in-state public colleges: “students are 53% more likely to apply to an in-state public college if they can see its scattergram and more than twice as likely to enroll in it.”
Essentially, when students can see a chart that compares their own GPA and test scores with others who have been admitted in the past, it’s easier for the student to say “hey, I can do this!” and apply. When students don’t have the scattergram for a particular college, they are less likely to have that confidence and apply.
Students apply to schools that accept students like them. The scattergrams show the self-reported admits and denies from that high school at colleges, and it also shows that average GPA and SAT/ACT scores for the college. High school students seem to pay a lot of attention to those green and red dots, applying to “colleges where they are most similar to previous admits.” Mulhern found a trend that students whose GPA and test scores were below average would still apply if there were more admits with similar numbers, and students who were above average were less likely to apply the further above the admits they were.
Students put a lot of weight into the average GPA line. We have to use some shortcuts to help us narrow down the thousands of available colleges into the handful (or several handsful) that we apply to. Mulhern saw that students using Naviance concentrate on schools for which there is a scattergram available, and she also finds that students use the average GPA line within those scattergrams as a quick way to decide if they’re likely to get in and if they apply: “students just below the GPA line are 8% less likely to apply to a college than students just above it.” She did not, however, find a similar trend with SAT scores, and suspects that’s possibly “because there are many sources of information on SAT admissions criteria.”
All these other things add up. If students are more likely to apply to schools that have visible scattergrams, and scattergrams become visible after a number of people have applied there, then students are therefore morel likely to apply to schools that are popular for their high school. And this keeps building up as more students end up applying to the same schools just because there’s available graphs. A student’s—an entire high school’s—portfolio of colleges get caught in this trend. Says Mulhern:
“Students who see more relevant scattergrams for colleges which are a good academic fit are more likely to attend a match college, while those who see more safety colleges are more likely to attend a safety college….This approach improves the quality of where some students attend, but deters others from attending highly selective or match colleges. This can impact students’ college degree attainment, future employment and earnings.”
What can current high school students do with these insights?
The first thing I’d say is not to stop using scattergrams. They’re very useful. People need some shortcuts to narrow down their search, and if scattergrams help you confidently apply to four universities instead of haphazardly applying to 16, then that’s a good thing. I’m also very encouraged by the positive effects of scattergrams on historically underserved and undermatched groups.
However, the findings really remind us to be very aware of the inherent blindspots involved with using scattergrams. To only apply to schools where you can see scattergrams is the same as deciding you only want to apply to colleges where a large number of former students at your high school applied. That’s a really unwise and unhelpful criteria—it has nothing to do with you.
You also want to understand what’s not included in the scattergrams. They only show data for your high school, not the college as a whole. That can make for some warped data. Also, the acceptances and denials you see on the scattergrams are self-reported by the students. While high schools have ways to encourage and/or coerce that information out of students, we can be pretty sure that denials are under-reported—people just don’t like to talk about them. What’s really key, though, is that the scattergrams only show GPA and test scores. Any university that uses holistic admissions—and that’s most of them—take a lot more factors into account. So you’re getting a very small estimate of the whole.
So by all means use those scattergrams and find places that seem to want students like you. But please, please, please do not rely on them, and don’t forget to pay attention to schools that may be looking for students exactly like you who don’t currently have a scattergram available.
Thanks for reading! Please send this to someone who would like to read it, or share it on your social networks. There are lots of ways to get regular updates from Apply with Sanity: like on Facebook and Twitter, and sign up for the monthly newsletter.
Apply with Sanity doesn’t have ads or annoying pop-ups. It doesn’t share user data, sell user data, or even track personal data. It doesn’t do anything to “monetize” you. You’re nothing but a reader to me, and that means everything to me.
Photo by Zoe Herring.
Naviance is a registered trademark of Hobsons, who does not endorse this website.
Apply with Sanity is a registered trademark of Apply with Sanity, LLC.